December 2023
Gill Adams, Parinita Shetty, Cathy Burnett
Since the field of primary literacy research in England (and elsewhere) brings together so many different communities, we are constantly looking for creative new ways to communicate our research findings to diverse audiences. In this podcast episode, Layla Gharib talks to Cathy about how she visualised the findings of a scoping review of literacy research that Cathy produced.
About a year and a half into the project, when we’d generated data on teachers’ encounters with research in primary literacy and were deeply engaged in analysis, we wanted to work with an artist to represent the complexity of teachers’ encounters with research and the way these were entangled in their work and their personal lives. We were fortunate that Lo Tierney was able to take on this work.
We had an initial online meeting with Lo where we explained what we were thinking of. We knew that we weren’t looking for traditional infographics or examples of conventional data design. Like many artists, Lo has a website with examples of her work. We pointed at the ones with features we particularly liked for our preferred aesthetic tone. Specifically, we were drawn to the samples which humanised the information in colourful ways and foregrounded Lo’s own personality and priorities.
In our meeting with Lo, we shared an anonymised extract from one of our conversations with primary school teachers to give Lo an idea of the focus and scope of the proposed images. Even between the three of us in the research team, depending on our different experiences and interests, we were drawn to specific aspects of the extract and could imagine different things being illustrated. Lo’s own interpretation added to this pool of multiple viewpoints – something we absolutely welcomed.
We’d hoped that an artist would bring an alternative perspective to our data and Lo was up for the open-ended nature of the process. We didn’t outline which aspects of the data we wanted to highlight or how exactly we wanted Lo to illustrate the extracts. We wanted to make the process as collaborative as possible which is why we invited her to interpret our prompts as creatively as she liked. Lo wasn’t familiar with literacy research or the primary school context these teachers were exploring. This lack of knowledge proved to be an opportunity since it allowed Lo to interpret and illustrate the data fragments in ways that would be accessible to diverse audiences.
After the meeting, we sent seven short extracts of different teachers discussing their experiences/challenges with literacy research for Lo to choose from. She shortlisted three, sent us differently interpreted conceptual sketches for each of the selected extracts, and asked us to choose which ones to develop. Once we’d done this, Lo quickly sent us the final three images – which we all really loved.
In further conversation, what we noticed was that all the images seemed to present a somewhat negative picture. The teachers we spoke to had shared their challenges but also the opportunities of engaging with primary literacy research in the wild. Subsequently, we sent Lo another round of extracts to choose from. This time around, we wanted to ensure that we included some positive examples of encounters with research to present a more complex version of what the teachers had told us.
Working with Lo has not only led to new ways of communicating experiences of the teachers who participated in our project but also been hugely valuable as a way of thinking with and through our data. We hope to be able to work with another artist some time in 2024 to look across the data. One of our potential avenues is to work with an animator to make the research come alive in quite a different way.
The following exchange shows how the images prompted us to think further about the data. It also includes an example of how the quotes from teachers we shared with Lo invited multiple interpretations drawing on our diverse interests.
Gill Adams [GA]: Opening the email containing the artwork, I was struck by the power of the images, vivid colours, what seemed like a clear message on first glance swiftly followed by multiple possibilities occurring to me. The ‘free module’ image focusses in on one aspect of the data extract. The teacher talks about the way that this research-informed CPD module reached them and how it reinforced ideas they’d come across on a master’s course. They note the quality of the module, surprised that so much quality material is available for free.
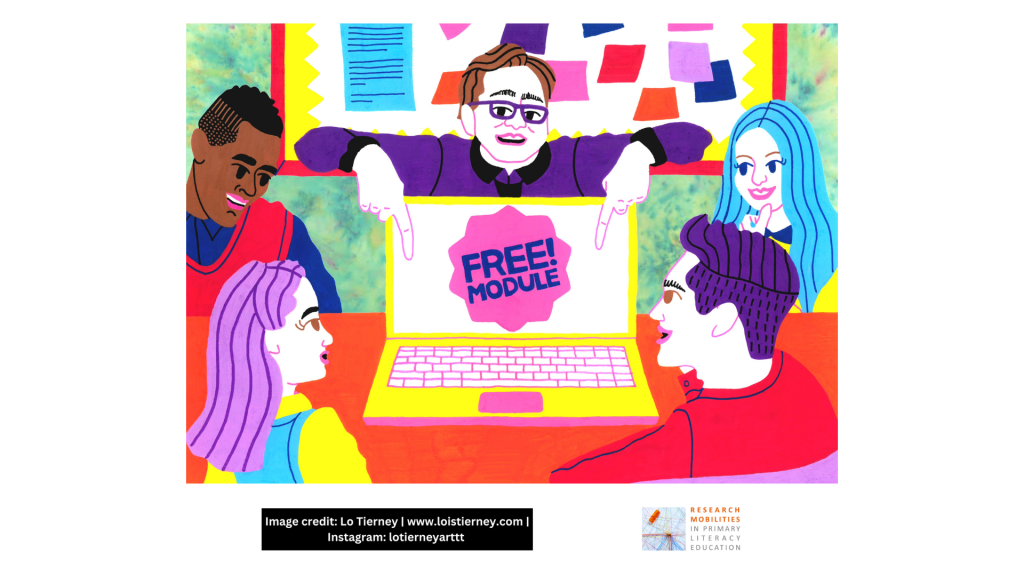
The images could be used in multiple ways, to raise questions, start discussions, probe experiences. I’d be interested to see what comes up if we share the images with literacy teachers, initially simply saying that they have been created in response to data extracts on the Research Mobilities in Primary Literacy Education – what do they see?
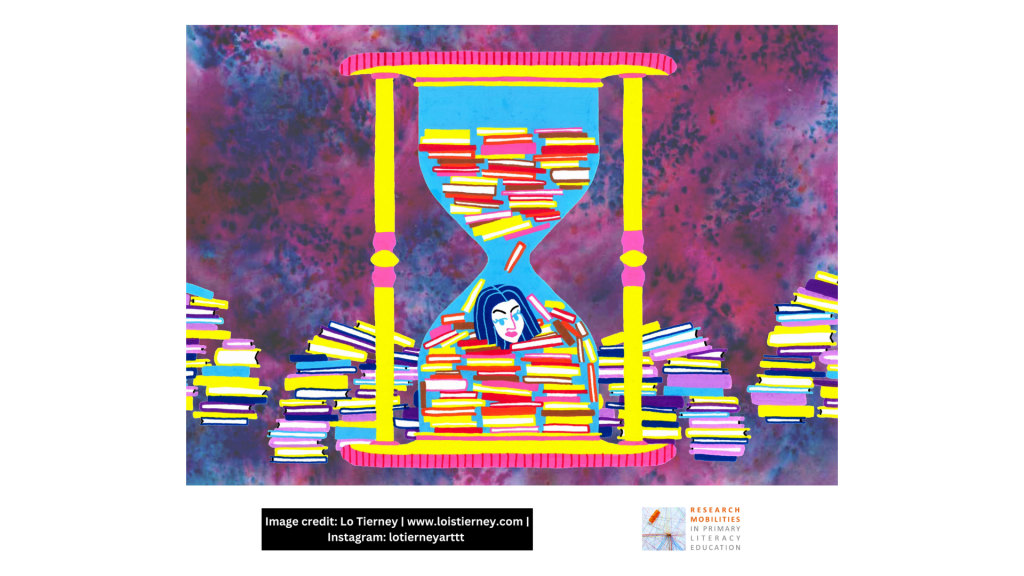
RESEARCHER: Is there something significant about that, that if you hear something mentioned, and you hear about it from somewhere else, that it sort of, I don’t know … feels more worth checking out?
TEACHER: Yeah, well I definitely think, I mean time being such an important factor, you sort of come away from a conference or reading an article or … going to a research group and somebody will have mentioned something and you’ve probably written a few things down but if another one of them gets namechecked again then I think that happens, in some ways I think that happens with books more, because books are so physical, erm, and then you think ‘Oh, I really should have read it by now because people keep talking about it and I still haven’t read it, I’ve just put it on my list of things to read’.
GA: The ‘multiple mentions’ (or is a better title ‘list of things to read’?) is such a powerful graphic image – this, and probably all the images could be used to provoke conversations about teachers and research, informing thinking about possible actions.
Cathy Burnett [CB]: Interesting, Gill. For me the significance of this extract is the point about ‘multiple mentions’- i.e. that ‘multiple mentions’ lead you to think that something is worth attending to – and that feels like a critical point when thinking about research mobilities. But I agree that the image has brought out the ‘list’ ness of the extract as well as time and a sense of the overwhelming nature of it all. So I guess that places ‘multiple mentions’ in tension with what it feels like to be in the midst of all this stuff and feel a responsibility to act on/with at least some of it (i.e. by focusing on a different aspects of the extract, Lo helps us to see these things as always entangled – the images mess with the neat themes, maybe?
GA: In the image responding to ‘it’s either coming in or it’s staying outside’ the blurring of boundaries between home and school is present in the juxtaposition of the desk and the armchair, the ‘love is love’ poster, the bright curtains, the pile of papers. The teacher is caught, mid-reflection, perhaps wondering how research can be accommodated within existing structures and processes.
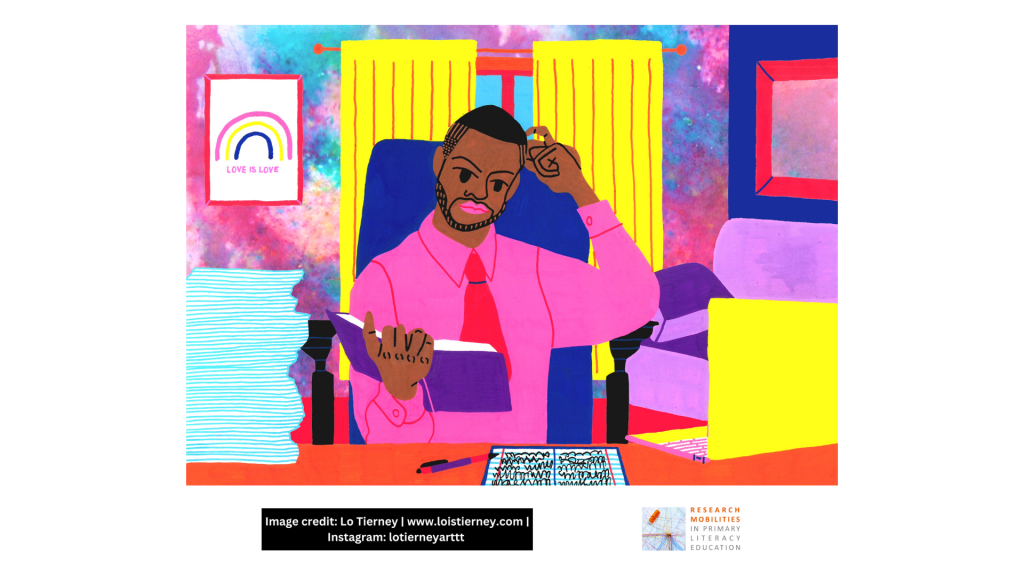
CB: Ah yes, I love the juxtaposition of texts (book, laptop, notebook) and warm cheery room. Maybe I am stuck in a groove now but the ‘text-ness’ of the research (writing on page and screen) hints at the ‘what is lost’ from the original research – which of course has to get made real again as it enters warm, personal, specific spaces.
GA: The teacher up high on a ladder, selecting a book might be seen as reflection of the challenges teachers face in accessing research, the lengths (or in this case heights) they have to go to. They seem precarious, yet unconcerned, as if habituated to this precarity. I’ve just been working with the movements data again, thinking about chain reactions and this image represents a moment on one chain reaction described in the data fragment that acted as impetus for the drawing: the teacher has been following the Reading for Pleasure project, exploring teachers’ mini research projects that have been uploaded to the project website, and as a result is planning an event for parents to support them to encourage children to read more widely.
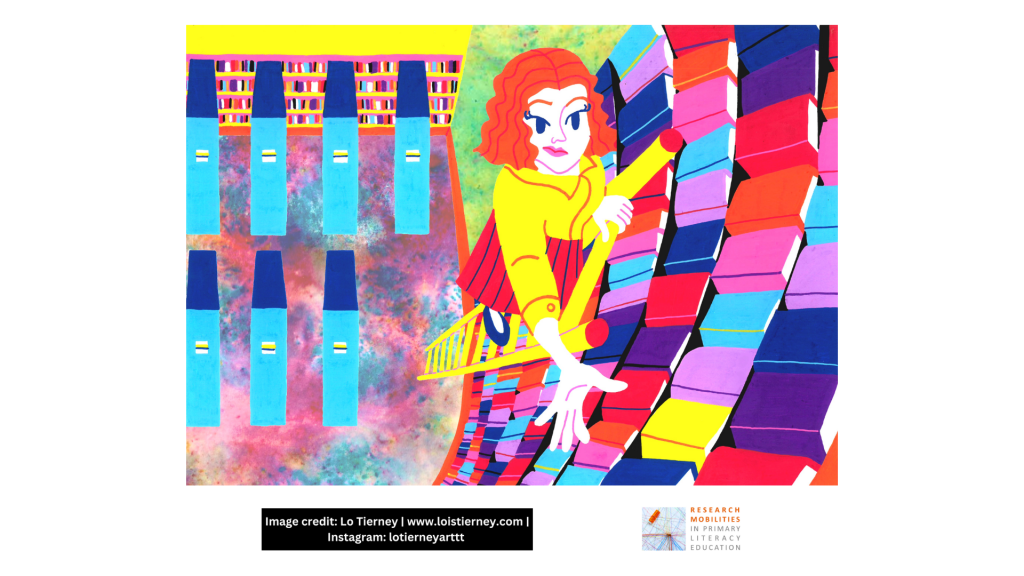
CB: For me, this one feels like it’s about risk but a risk that is embraced – an adventure! Which is interesting because when I read the quote it feels quite mundane. Perhaps Lo challenges these preconceptions, pushing us to see how things can be thrilling, even if I wouldn’t see them as such.
I seem to remember Lo intended to evoke a scene from Beauty and the Beast here – is that right? (which of course I missed … in which case, what else am I missing … and how might teachers find the pathways made by researchers/brokers/head teachers/research summaries/social media etc. difficult to follow …)
Parinita Shetty [PS]: I’m endlessly fascinated by how the same thing can mean different things to different people. I brought up this image in a meeting recently as a positive example of teachers’ encounters with research. What I remembered most vividly about it was that this view atop a ladder represented how research allowed teachers to access unfamiliar ideas and look at the world from a new perspective. I’ve just gone back to Lo’s initial sketches for this image and one of the captions says, “teacher looking at books from unique angle” – which is what helped guide my thinking down this path. I think this shows perfectly how these collaboratively developed images not only bring together diverse viewpoints but can also invite different kinds of questions, reflections and ideas when shown to different communities interested in primary literacy research. How will other teachers respond to them? What aspects will teacher educators focus on? How about people who work in education charities, education consultants or policymakers? As Layla and Cathy discussed in their podcast episode, by showing a range of experiences rather than providing clearly defined answers, these images open up discussions rather than shutting them down.
GA: As I study the image for ‘research tends to be watered and filtered down’ I realise that I can’t see where the start of the chain is – it isn’t possible to discern who is starting the circulation of the research. And this is often what teachers have told us – sometimes they can’t recall where they first came across some research, other times they can trace their introduction to it back but when we continue to trace it isn’t always clear where the research originated or even if it is research. And although the image represents the filtering of research, it doesn’t show the complex patterns of dissemination, both planned and unplanned. The images and the fragments together can be used to raise questions, perhaps in an article in Impact, TES or a similar teacher-focussed publication.
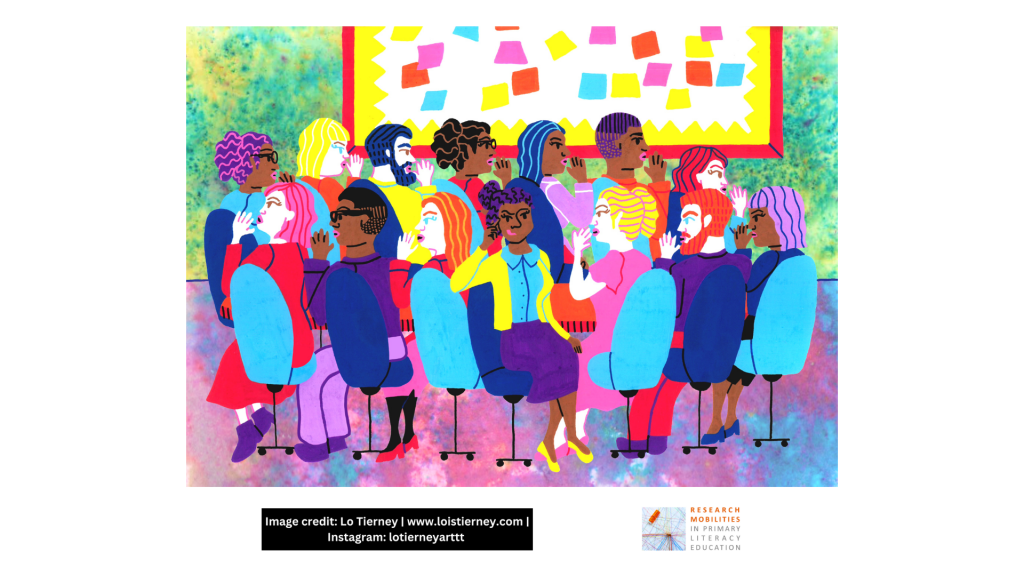
CB: Yes, I guess it raises questions about we get a SENSE of a consistent message, when of course it is likely to be eroded/changed/amended/etc.
GA: What do the images do? I’m interested to find out what they might do out there ‘in the wild’, whether and how they might come to represent some of the teachers’ stories of encounters with research. How might we share them? And, regardless of our intentions, I’m aware that an image might ‘break free’ from the data fragment, from the project too and be taken to represent something other, perhaps not in keeping with our aims. The one step we can take to try to ensure there is always a traceable link back to the project is to ensure that, in addition to Lo’s credit on each image as we use it, we include a link to the project website. We can also have a link there to the methodological toolkit and other publications which will explore these images in more depth.