This post is a transcript of the second episode of our podcast Research Mobilities. It looks at how researchers can collaborate with designers to visually represent their research to new audiences. Professor Cathy Burnett chats with designer/researcher Layla Gharib about how the process of developing the images together resulted in new ways of thinking and working. They also explore how these images provide space to invite different interpretations, questions and conversations.
You can listen to the episode here or wherever you get your podcasts by looking for Research Mobilities.
https://spotifyanchor-web.app.link/e/0r93MIuJkIb
Cathy Burnett [CB]: My name’s Cathy Burnett. I’m Professor of Literacy and Education at Sheffield Hallam University and I’m working on the Research Mobilities in Primary Literacy Education project.
Layla Gharib [LG]: Hi I am Layla Gharib. I am a PhD student at Sheffield Hallam currently researching the decolonisation of design education. But I was the graphic designer for visualising some of the ideas that Cathy’s going to introduce in a moment about the project that she’s been working on.
CB: Thanks Layla. Yes so the project that we’re looking at is called Research Mobilities in Primary Literacy Education. And we’re looking at the kinds of research that teachers engage with related to literacy. One of the starting points of this project is that there’s a wide range of literacy research being done across the world from different perspectives, with different insights – thinking about literacy in quite broad and creative and interesting ways. And as a project team, we were kind of interested in which kinds of literacy research from this really broad range were actually making it into teachers’ lives or that teachers were engaging with or interested in or coming across.
So in order to just kind of start off thinking about that, what we felt it was important to do was to do a piece of work which was sketching what this range actually was. So I did some work looking at all the work that had been published around literacy in eleven different journals over about the last five years. And people can read that separately if they want to. They can find that elsewhere. But what that resulted in was a set of, if you like, different orientations to literacy research. Different ways of thinking about literacy research which we think are useful in highlighting different ways in which literacy research might speak to literacy education.
But it’s quite complicated work. Unless you’re a literacy researcher, it is quite difficult to navigate because it comes from different areas. Some of it’s from psychology, some of it’s more from sociology. Some of it’s from neuroscience, some from literary studies. So it’s quite difficult to kind of navigate that range unless you’re a literacy researcher. So one of the things we wanted to do was to create a visualisation that would represent all these different kinds of research – what they might say, what they might offer, the different methodologies they draw on. And this is where [laughs] Layla we asked if you might be willing to tell us something. Which of course you did!
LG: Yeah. I think like you’re saying about you obviously coming from a literacy background and having that kind of context already which I think for me, coming from perhaps a little bit outside of that was …
CB: Mhmm.
LG: At first almost I thought “oh this is slightly daunting”. But I think there was something quite perhaps important about me coming from a different space and not necessarily knowing everything about the context surrounding this work that you’re doing that allowed me to perhaps visualise these, as you call them, orientations in a way that might be accessible to people from different audiences and backgrounds. So that felt like a positive thing. And I think in that initial meeting that we had – when I met you Cathy, and we was talking about what the plans for these visuals might look like, these different orientations – I think there was like three points that we had as a starting point.
That being that you wanted perhaps one visual that captures – and I think we used the word – explores these different orientations. So you know showing the scope of what that might be. And then the second one being that there are multiple entry points for teaching literacy and how we might visually capture that overlap was another one of the points. And then also to leave space for new or future orientations. I think you was quite sure of this like not being a project where you’re saying you’ve captured every possible orientation for literacy to somehow, in the visual, allow the space for new ideas to emerge. So those were like the three points, as the starting point I think for like the visual that might have emerged from that.
So with the intention of having one visual that captured those different orientations, that kind of shifted a little bit towards the end of the project. So we ended up with three visuals, didn’t we, in the end. That being that we had a theoretical perspective of the underpinning of those orientations. And we also had the implications that arise from those scoped orientations. And also the methodologies underpinning those orientations. So we ended up with three images which hopefully when people hear this, they’ll be able to see those different orientations.
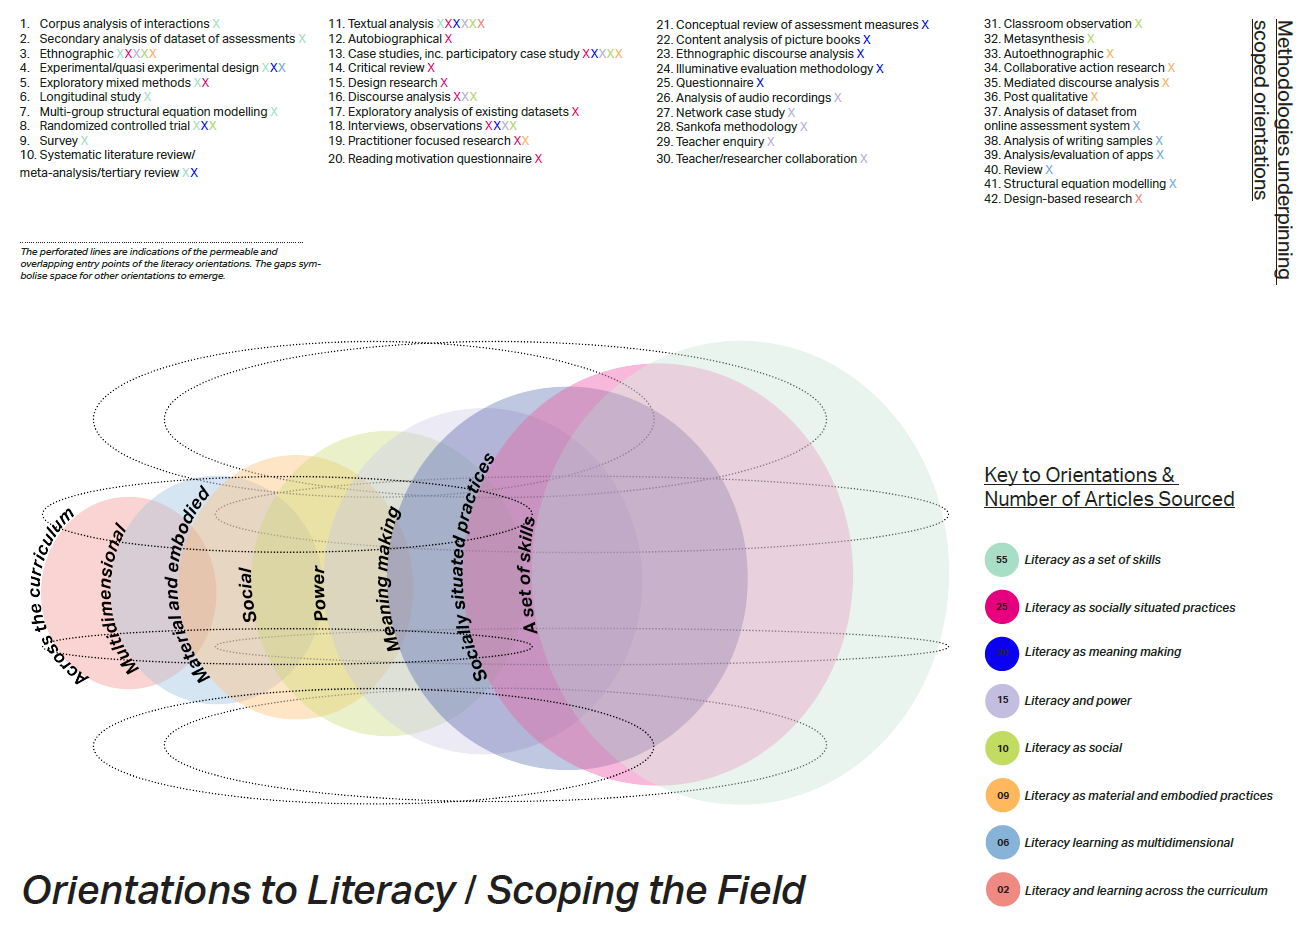
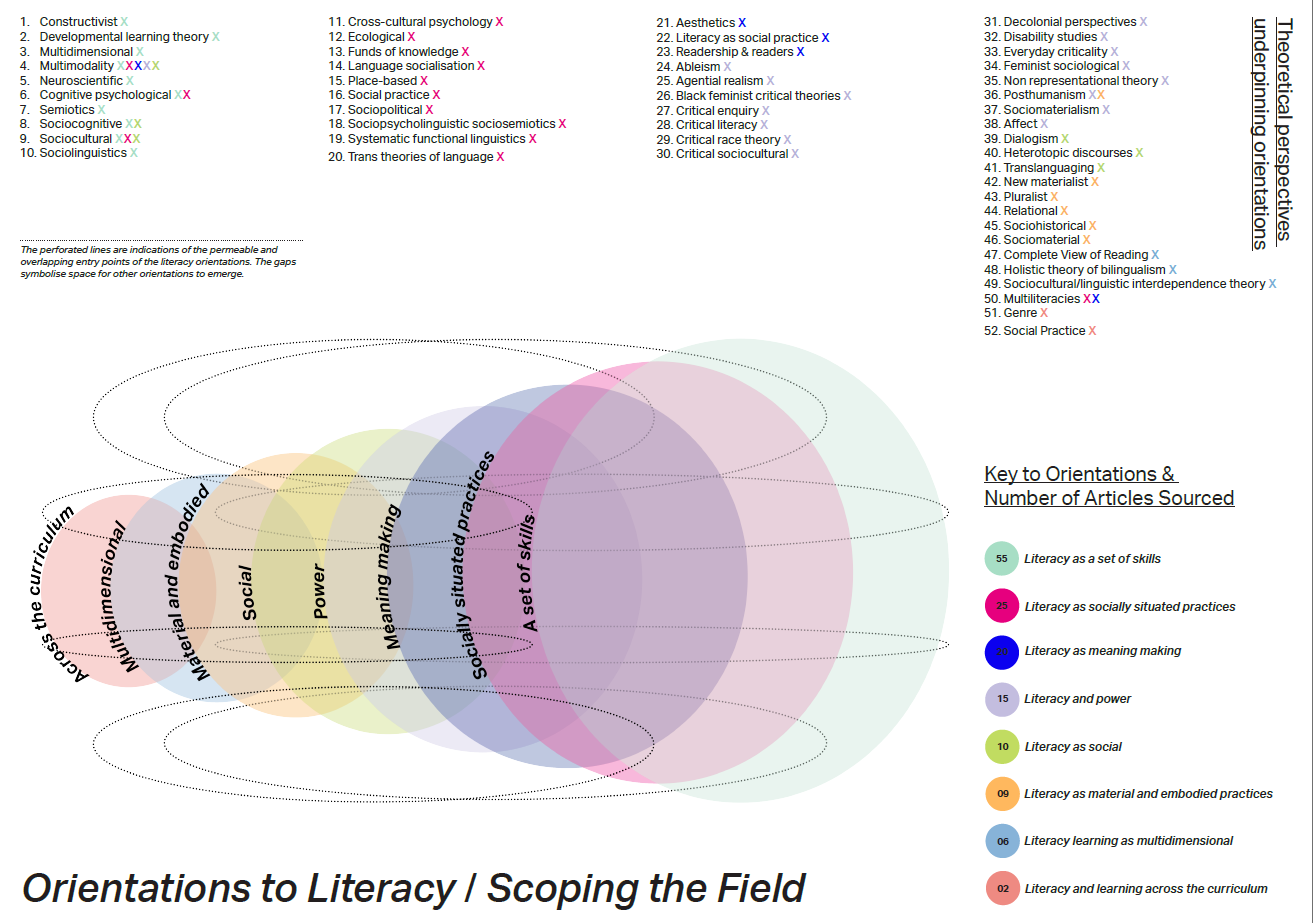
So that was kind of the outcome I guess. We have these three different visuals, didn’t we. There was a key element involved where we mapped out the different things that underpin these different orientations.
CB: Yeah. I’m thinking about the visualisation that you did for implications, which is really sort of incredible to look at in some ways. Because you’ve got this sense of different orientations and then around it you’ve got all this – it’s kind of lengthy lists of different implications and different ways in which they might speak to literacy.
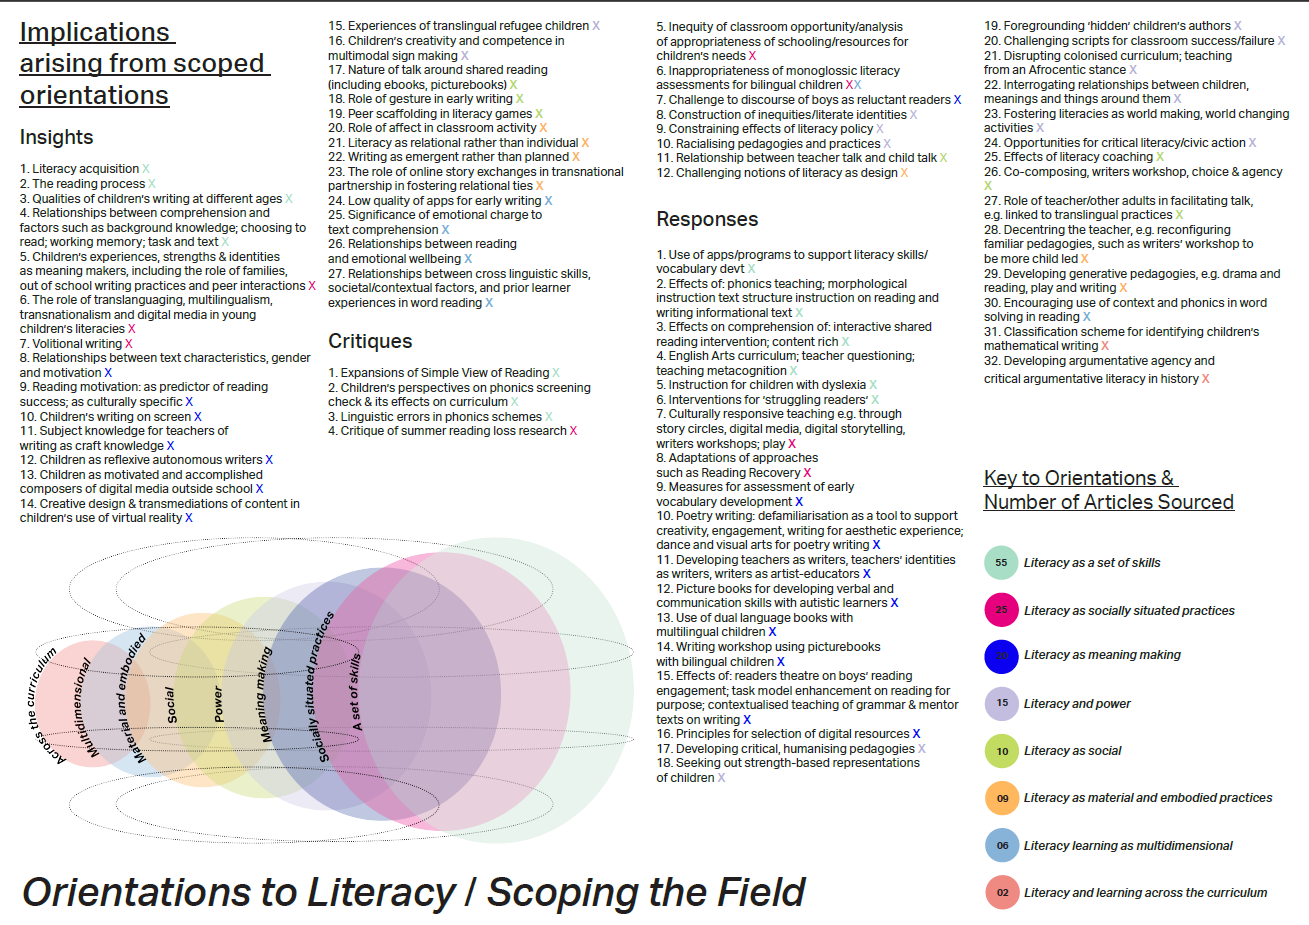
I found that really interesting as a visualisation, partly because I’m a real novice in terms of visualisation and infographics and all of those kinds of things. What I have read, the guidance is always “keep it very simple”, “make it very immediate”, “people should be able to look at this thing and immediately know what it’s saying”. And I would say that really isn’t the case with that one. Because you’ve got this huge number of lists of things. And in order to kind of delve into it, you’ve really got to look in detail and different people might see different bits. And there’s a huge amount to kind of take on board.
And I’m really interested in what that does actually … for us. In a project where we are actually in a way trying to say literacy isn’t straightforward, there are different ways of looking at it, different ways of responding, different professional choices that teachers will have to make. And there’s something about that image which sort of does that in some way. And I don’t think I’ve told you this but I shared that – well all the images actually but particularly that one. And it was really interesting to kind of look at that huge, rather overfacing image to begin with and then to begin to pick out little examples of things. So “I’d like to know a bit more about that”, and “that sounds really interesting”. And I’ve had this conversation with a couple of people now where the complexity starts to generate questions.
LG: Hmm.
CB: And starts to generate “Oh I’d like to know a bit more about that”, “Oh I haven’t thought about that”, “Oh I wonder what that could be”. So it’s really kind of succeeding, as I see it, as an image that invites discussion and leads to further questions rather than “This is what it is”.
LG: Yeah, that is super interesting. There’s something really nice in you kind of saying that the complexities might lead to some kind of discussion. Which I think as a designer, that’s something we tend to always want to avoid like making things complicated, which I think is necessary in like making things visually accessible. But there’s also the danger of oversimplifying things where we wouldn’t have been able to get the context needed if we had not had these kinds of lists along with the image. But if that’s becoming a way for people to perhaps ask more questions or starting points for other kind of conversations – that I guess kind of shows that as an approach, that worked. Which I think is – that’s exciting.
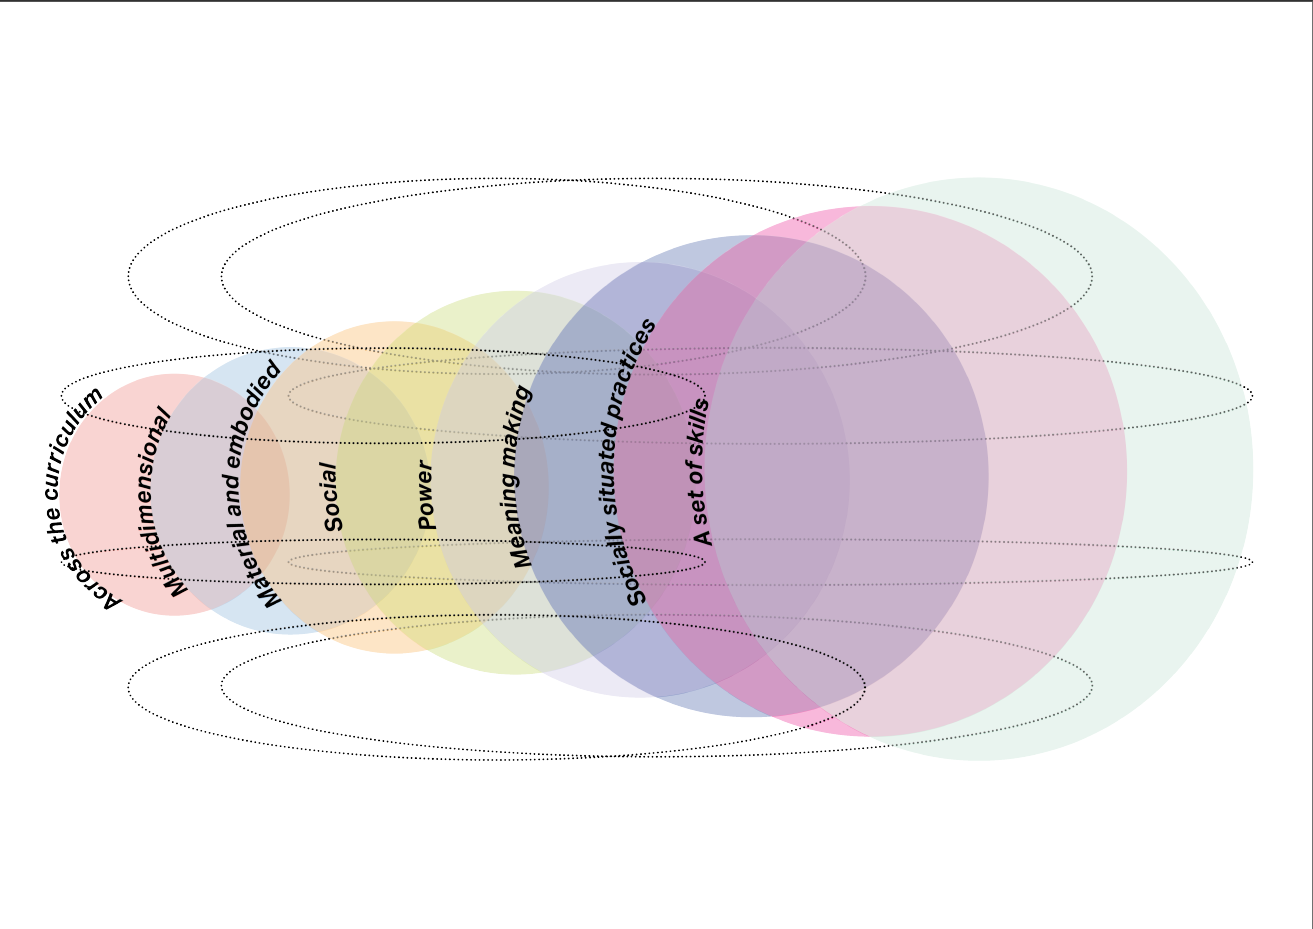
So we had the kind of circular tunnel diagram as a starting point. It utilised various opacities in the colours that we used to suggest these potential overlap between the orientations – that is where that began. And I think the idea behind that was to provide whoever was you know reading these visuals with the possibility to enter and to travel through those different orientations. Depending on the kind of specific teaching approach. We were very aware not everybody enters these orientations from the same space. So I think that kind of integration of those different contexts felt important.
CB: That’s really interesting to hear you talk about that again. And again I’m reflecting on a conversation I’ve just had recently around the image. And the discussion was that the image reminded people of like a telescope or you know a series of lenses. That was interesting. Which is a different way of thinking about what the same image does. Kind of focusing in on different bits or different aspects. And I can see that as a kind of method of thinking about literacy learning, how you might be zooming out to look at something or you might be kind of focusing in on something very specific. Different lenses throwing up different ways of thinking about literacy. So it was really generative in that way as well, I think.
LG: Yeah and I think you know in order to like most effectively address that issue of overlap and perhaps identifying – I think we began to call them like potential entry points. When I was researching how to best to do that, there was some different diagrams I came across about how entry points might be visually made up. So I think the most effective approach was determined to be you know a three-dimensional representation of the circular orientations which is what we had in the end. This idea of the edges being suspended and layered to create that kind of dynamic visual experience. That layering became a quite useful tool I think to suggest these different approaches.
CB: I also really love the big connections you make across the different entry points. There’s kind of floating above and around, aren’t there. There’s potential in the drawing for other things to appear which links to what you were saying earlier.
LG: Yeah, kind of that leaving space for new or future orientations. That’s where kind of the perforated lines on the visual came into play. So the idea that these are permeable and you know that things can enter; they’re not absolute. So that was kind of the idea behind having the eight orientations but then also suggesting these like alternate ways of doing through those kind of perforated circles. Which I think it created an environment of openness on some level visually and kind of hopefully encourages whoever reads into this, there is potential to explore you know new ideas and perspectives in this kind of field.
CB: That’s so interesting. And I love it. I think it’s got huge potential for talking with and among a whole range of people about what we’re trying to do. And really opening out possibilities in the project. So it’s been really valuable and I’ve not worked in this way in research with a colleague who’s not part of the central research team. So it’s been really interesting to do this. And I think for me what it’s done is given me a – you talked about the sort of importance of being an outsider to the project in a sense – or not part of the central team and bringing in new perspectives. And I think it’s made me think more deeply about what we’re finding. I think I envisaged this initially as an image that we would be able to use and take elsewhere. And it is. But I think it’s also the process of working this through with you has really helped my thinking about what it is we’re trying to say and what it is we’re trying to do. I wondered if you’d had any thoughts about this whole kind of thing about working with researchers on visualisations and what that meant for you.
LG: Yeah I think for me anyway it’s been a very interesting project in terms of developing my kind of understanding of working with people from different fields. In the sense that when I’ve worked on research projects and visualisations before, I’ve been very much embedded in them. So it almost becomes hard to get out of all of the context that you’ve been you know in the data collection and everything. You’ve got all of this kind of baggage. So when it comes to visualising something, it’s hard to almost imagine not being a part of it as someone who might just be seeing this visual for the first time. So that’s often like more challenging.
Whereas coming into this work, having to do the work, to understand the context of what you’ve been working on was really nice. Kind of spending that time with your research and then visualising it in a way where I perhaps – I don’t know perhaps if someone more involved in the project had worked on it, it might have – I can’t speculate, but it might have felt more challenging. I know it has done in the past when I’ve worked on visualisations for projects that I’ve you know been more involved in the research process. So yeah it’s been a real learning journey for me as well and quite nice to not feel super precious about all of this stuff. In terms of I’m coming to it with not all of this kind of research baggage that I’ve perhaps come into things with in the past. So that felt freeing. And perhaps I think it allowed me to approach it in a very much more of a direct way where I got places a lot faster [laughs] than I had done before. So that felt very freeing.
And yeah I really, really loved that point you made about the complexities being a moment for discussion and questions. Which I think really shows the potential of this project as a whole. Not just talking about the visuals – kind of this generating a hope I guess to foster a culture of innovation and creativity in this kind of field of literacy.
CB: Thank you, it’s been lovely talking to you.
LG: It’s been lovely being here. Thank you for having me.
CB: Well hopefully we’ll get to work again sometime.
LG: Definitely, yes. That would be lovely.
CB: And thank you so much again for all you’ve done. It’s been a really interesting addition to the project and you know it’s only just started to gain a life but I’m interested to see where it goes. So I’ll let you know if we get any other feedback or thoughts or comments that might be interesting to you.
LG: Yeah definitely do. And if you’re saying that it’s providing space for discussion and conversation, that’s I guess all we can hope for as researchers.
CB: Absolutely, yeah. Thank you!